Tools for Monitoring Compute, Storage, and Network Resources
To scale and application and provide a reliable service, you need to understand how an application behaves when it is deployed. You can examine application performance in a Kubernetes cluster by examining the containers, pods, services, and the characteristics of the overall cluster. Kubernetes provides detailed information about an application’s resource usage at each of these levels. This information allows you to evaluate your application’s performance and where bottlenecks can be removed to improve overall performance.
In Kubernetes, application monitoring does not depend on a single monitoring solution. On new clusters, you can use two separate pipelines to collect monitoring statistics by default:
The resource metrics pipeline provides a limited set of metrics related to cluster components such as the HorizontalPodAutoscaler controller, as well as the
kubectl toputility. These metrics are collected by metrics-server and are exposed via themetrics.k8s.ioAPI.metrics-serverdiscovers all nodes on the cluster and queries each node’s Kubelet for CPU and memory usage. The Kubelet fetches the data from cAdvisor.metrics-serveris a lightweight short-term in-memory store.A full monitoring pipeline, such as Prometheus, gives you access to richer metrics. In addition, Kubernetes can respond to these metrics by automatically scaling or adapting the cluster based on its current state, using mechanisms such as the Horizontal Pod Autoscaler. The monitoring pipeline fetches metrics from the Kubelet, and then exposes them to Kubernetes via an adapter by implementing either the
custom.metrics.k8s.ioorexternal.metrics.k8s.ioAPI. See Full metrics pipeline for more information about some popular pipelines that implement these APIs and enable these capabilities.
cAdvisor
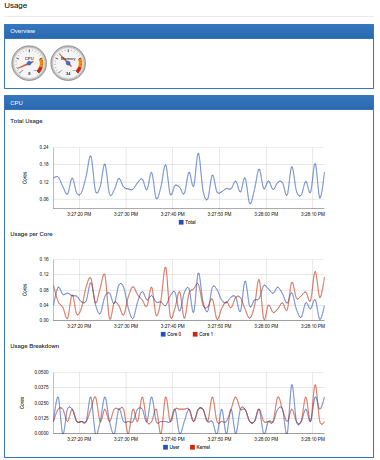
cAdvisor is an open source container resource usage and performance analysis agent. It is purpose-built for containers and supports Docker containers natively. In Kubernetes, cAdvisor is integrated into the Kubelet binary. cAdvisor auto-discovers all containers in the machine and collects CPU, memory, filesystem, and network usage statistics. cAdvisor also provides the overall machine usage by analyzing the ‘root’ container on the machine.
On most Kubernetes clusters, cAdvisor exposes a simple UI for on-machine containers on port 4194. Here is a snapshot of part of cAdvisor’s UI that shows the overall machine usage:
Kubelet
The Kubelet acts as a bridge between the Kubernetes master and the nodes. It manages the pods and containers running on a machine. Kubelet translates each pod into its constituent containers and fetches individual container usage statistics from cAdvisor. It then exposes the aggregated pod resource usage statistics via a REST API.
Full Metrics Pipelines
Many full metrics solutions exist for Kubernetes. Prometheus and Google Cloud Monitoring are two of the most popular.
Prometheus
Prometheus natively monitors Prometheus. The Prometheus Operator simplifies Prometheus setup on Kubernetes, and allows you to serve the custom metrics API using the Prometheus adapter. Prometheus provides a robust query language and a built-in dashboard for querying and visualizing your data. Prometheus is also a supported data source for Grafana.
Google Cloud Monitoring
Google Cloud Monitoring is a hosted monitoring service you can use to visualize and alert on important metrics in your application. can collect metrics from Kubernetes, and you can access them using the Cloud Monitoring Console. You can create and customize dashboards to visualize the data gathered from your Kubernetes cluster.
This video shows how to configure and run a Google Cloud Monitoring backed Heapster:

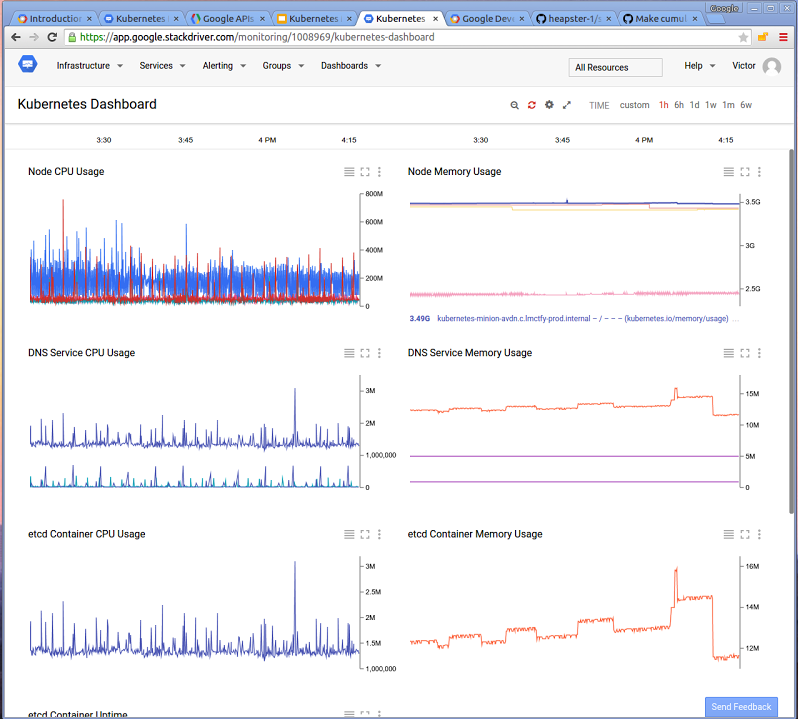
Google Cloud Monitoring dashboard example
This dashboard shows cluster-wide resource usage.